Employee Happiness Erodes in Q3 as The Great Gloom Continues
BambooHR Research Shows Average eNPS Slump for 3rd Quarter in a Row
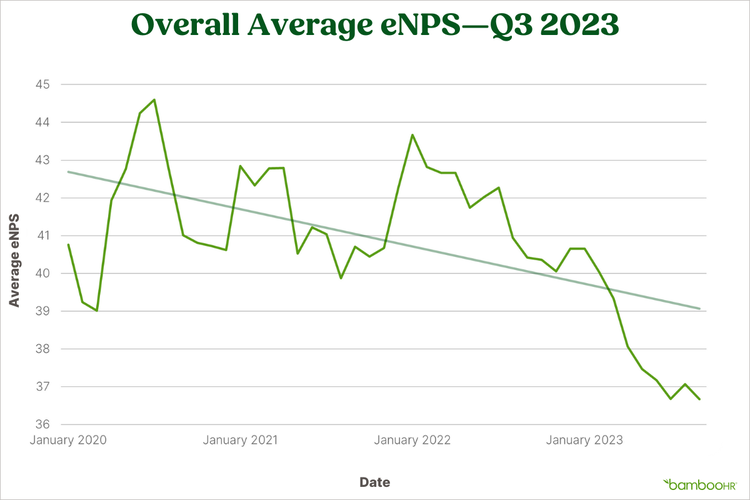
In September 2023, employee satisfaction reached a new three-year low:
- September 2023 eNPS dropped to 36, half a point lower than in June 2023.
- The average eNPS for Q3 is a full point lower than in Q2 2023, dropping from 38 to 37.
- Comparing September 2022 to September 2023, there's a three-point difference, representing a significant 9% decrease in eNPS year-over-year (YoY).
Employee Happiness Key Takeaways
Key Takeaways by Employee Group
- Employee Tenure Companies with an average employee tenure of less than three years are generally happier, but newer hires hit a three-year low in Q3.
- Company Headcount Small- and medium-sized businesses (SMBs) with fewer employees tend to have happier employees compared to larger companies.
Key Takeaways by Industry
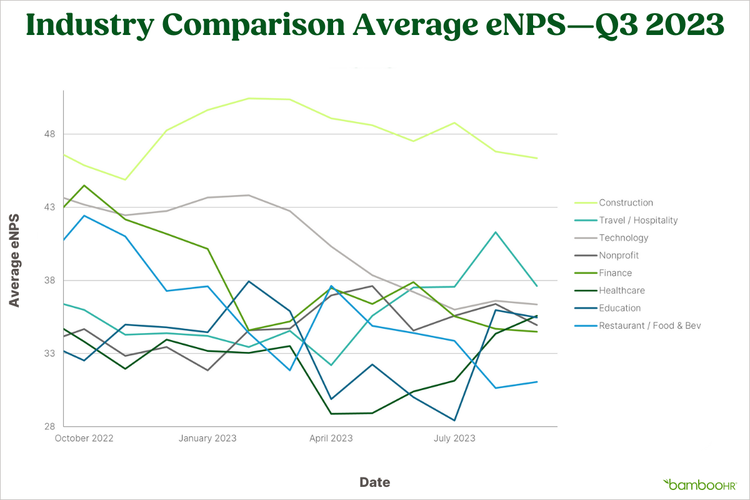
- Construction (1) Despite a small slip from Q2 to Q3 and from 2022 to 2023, construction still reigns as the happiest industry.
- Travel & Hospitality (2) maintains its positive trajectory as the only industry with growing employee happiness. Q3 scores were four points higher than Q2 2023.
- Technology (3) continues to fall from its record highs to a new three-year low. Tech’s average employee happiness was three points lower in Q3 than in Q2.
- Nonprofit (4) scores from Q2 to Q3 are flat, but year-over-year is up one point.
- Finance (5) also hit a new three-year low, 17% lower than in 2022.
- Healthcare (6) rebounded with a five-point increase in eNPS from Q2, reflecting a 17% improvement since June, and this upward trend is expected to continue into Q4.
- Education (7) rebounded in Q3, with an 18% increase in eNPS from June of 2023 and a full point higher than last September’s score.
- Restaurants, Food & Beverage (8) hit a new three-year low and slipped to last place, seeing a 10% drop since June 2023, and a substantial 21% drop in September YoY scores.
Since the beginning of January 2023, employee happiness has been in freefall, showing a strong correlation between economic conditions and employee happiness and engagement. Job security and income stability are essential factors affecting micro job satisfaction—as well as macro consumer confidence and economic growth.
Qualtrics 2024 Employee Experience Trends reports “gaps in recognition, low satisfaction with financial rewards, and a lack of growth and development opportunities,” which leaves workers feeling unappreciated, unheard, and unsupported at work.
According to Gallup’s State of the Global Workplace 2023 report, low employee engagement is hurting the global GDP to the tune of $8.8 trillion dollars. The report says it best: “If you’re not thriving at work, you’re unlikely to be thriving at life.”
Read on to learn how these trends are changing over time, what the impact is by industry and company demographics, and what you can do to pierce the gloom in your organization.

What’s Employer Net Promoter Score? (eNPS*)
eNPS helps employers measure employee satisfaction. It consists of a numeric rating of how likely employees are to recommend the organization as a place to work. Employees select a score from 0–10, and these scores (categorized as Promoters, Passives, and Detractors) are used to quantify how employees feel about their company.
The eNPS score is then calculated by taking the percentage of Promoters and subtracting the percentage of Detractors. The resulting score can range from -100 to +100, with higher scores indicating a higher level of employee satisfaction and loyalty.
*Net Promoter, NPS, and the NPS-related emoticons are registered U.S. trademarks, and NetPromoter Score and Net Promoter System are service marks, of Bain & Company, Inc., NICE Systems, Inc. and Fred Reichheld.
Which Employee Groups are Happiest?
Surprisingly, the smaller the company or the newer the employee, the happier they are.
eNPS responses were sorted by employee tenure, if a company’s employees had been there fewer than three years or longer than three years, and by company headcount, or the number of employees a business employs.
New Hire Happiness Drops to Three-Year Low
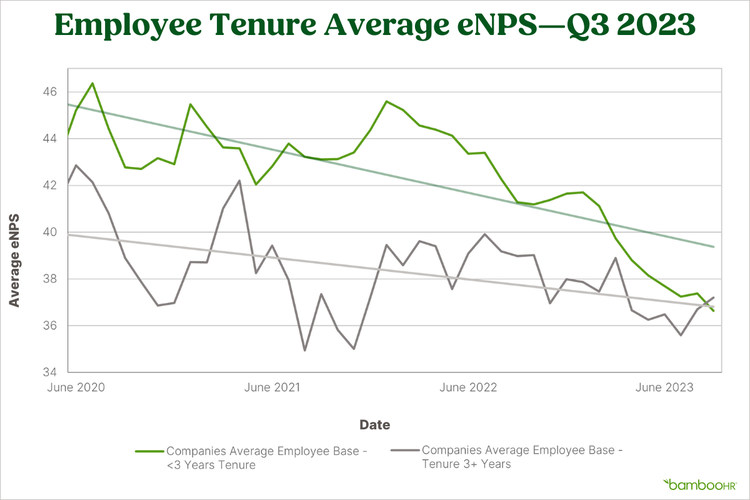
While companies with employees who have less than three years of tenure tend to be happier on average, the same group is also experiencing a three-year low in happiness.
Conversely, companies whose employees average three or more years of tenure, who have traditionally been less happy, reported higher eNPS scores compared to this time last year. The graph above shows that the two groups, who used to be quite different, have now converged.
It’s possible that in previous years, new employees were usually happier because they were in the “honeymoon phase” of a new job. Still, with recent layoffs, strikes, and inflation, it’s leveled the playing field. In another 2023 BambooHR study, nearly half of employees (45%) said they put up with little frustrations at their job because they’re unable to quit, with income and job security being the top two reasons for staying.
Q3: 37
Q3: 36
Q3: 36
Q3: 37
How to Pierce the Gloom: Nail the Onboarding Process
Onboarding sets the tone for the rest of an employee’s feelings about their employer. In a BambooHR onboarding survey, 62% of employees said their impressions of their company from the first day at work are still accurate.
So what do your newest employees need to feel happy and successful? Nearly all new hires want onboarding to include an introduction to employee guidelines (97%) and the company's mission statement and values (96%).
Another important way to make everyone feel more invested in the workplace culture is to connect your more tenured people with newcomers from the get-go. Building those types of mentoring relationships ranks high on new hires’ priority list:
- 93% of new hires want to shadow a colleague.
- 87% hope to make a friend at work.
- 86% appreciate support from an onboarding buddy.
Smaller Companies Have Happier Employees
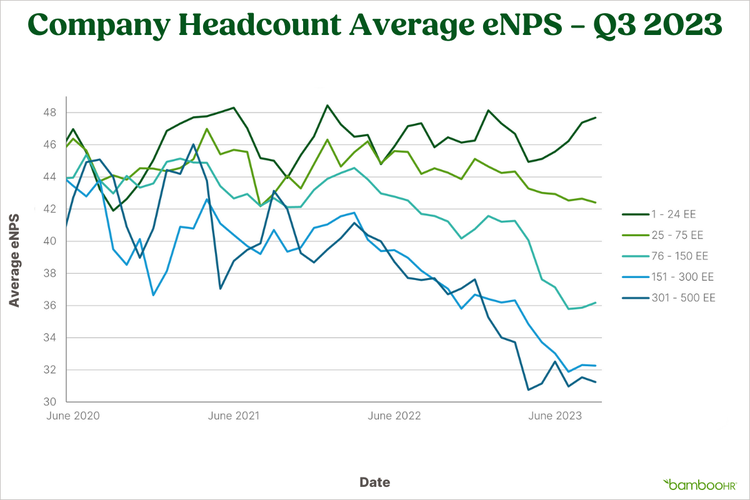
Company size plays an important role in employee happiness: Small- and medium-sized businesses (SMBs; fewer than 100 employees) and mid-market (MM; 100 to 500 employees) companies have happier employees compared to larger companies.
In 2020, all companies were relatively neck and neck, but starting in 2021, they’ve gradually spread across the eNPS scale. Smaller companies have maintained consistently high levels of employee happiness over time, while companies’ employee happiness drops as their headcount grows.
In Q3 2023, the widest employee happiness gap was between companies with less than 24 employees and those with 151 to 300 employees, with smaller companies having 32% higher eNPS scores.
Q3: 47
Q3: 47
Q3: 43
Q3: 42
Q3: 35
Q3: 37
Q3: 32
Q3: 32
Q3: 31
Q3: 31
How to Pierce the Gloom: Frequent and Transparent Communication
The widening gap in employee happiness as companies grow highlights the importance of tailoring and adjusting HR strategies over time, especially given the current economic instability. What employees needed or expected last year might no longer apply.
It’s important to proactively create a culture of open and transparent communication. Transparency builds trust and reduces uncertainty—in the job search, almost two-thirds of employees (60%) find companies more attractive when they’re honest about their strengths and weaknesses.
And when business is bad, employees need reassurance about what’s happening moving forward:
- 60% say companies should ease layoff fears by sharing actions they're taking to avoid further layoffs.
- 56% want transparency about why particular roles were let go.
What Industries Have the Happiest (and Unhappiest) Employees?
1. Construction Employees Are Still the Happiest
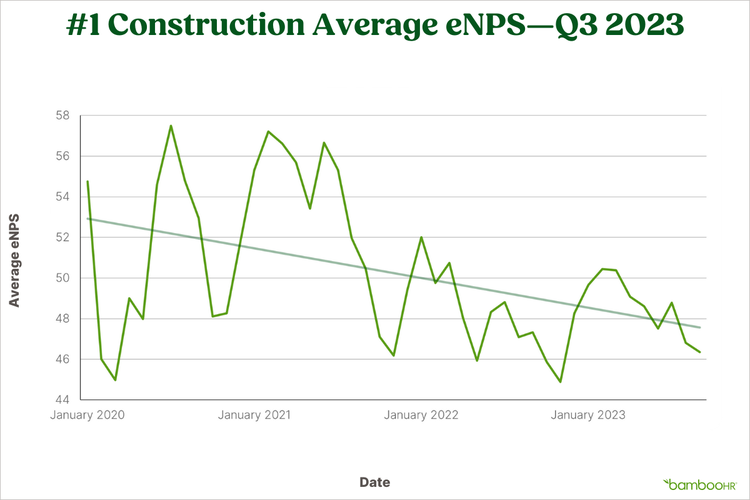
While average employee happiness scores in construction are still the highest ranking, eNPS scores are showing a continued, gradual decline. The decrease in eNPS, both in comparison to the previous quarter and the same period in 2022, shows the wear sky-high federal loan interest rates are having on construction.
Another important stressor is the construction labor shortage. In a nationwide survey of US contractors, the vast majority (85%) said they have open jobs they need to fill, but they aren’t finding the right talent. More than two-thirds (68%) say applicants aren’t qualified to do the work.
How to Pierce the Gloom: Focus on Loyalty and Training
While construction companies can’t control macroeconomic conditions, they can maximize the ground they have with their employees by gathering and implementing employee feedback to increase loyalty.
As for the labor shortage, some construction employers (41%) are already investing in employee development programs to give workers the skills they lack. There’s also room for construction employers to stand out from the competition with pay. While many (81%) have raised their base pay rates this year, only 20% say they pay overtime.
2. Travel and Hospitality Happiness Jumps from #6 to #2
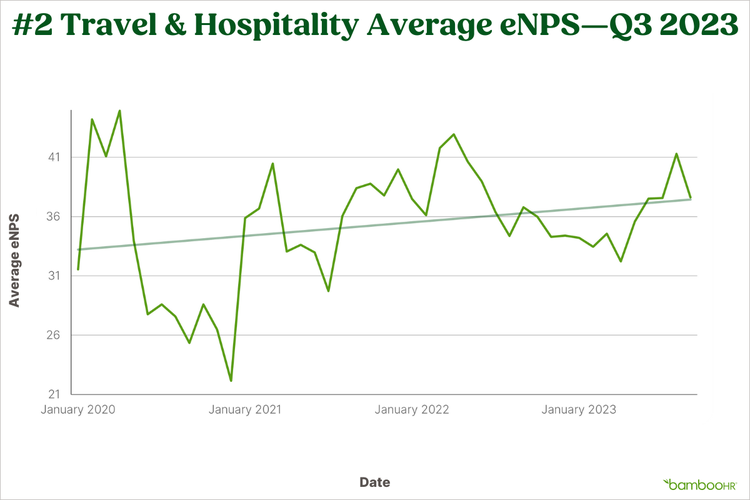
For the travel and hospitality industry, Q3 2023 has brought continued positive growth in employee happiness, with eNPS scores showing a substantial increase and making it the most favorable quarter seen this year for the industry.
The average eNPS in Q2 was 35, but it increased to 39 in Q3, representing a notable four-point improvement in employee happiness. The US Travel Association reported that air travel demand was up 12% in July compared to the same month last year, a reflection of a strong and growing travel and hospitality industry.
Combined with a rising eNPS, this suggests the industry is recovering, resulting in a resurgence in employee morale and satisfaction.
Pent-up demand created during the COVID-19 pandemic continues to create growth despite consumer spending fluctuations elsewhere. Good business spells happy employees, who likely feel more secure in their employment compared to other service industries.
How to Pierce the Gloom: Focus on Employee Experience
Similar to construction, travel and hospitality leadership should double down on employee happiness by gathering and implementing feedback to create employee loyalty.
A great employee experience will strengthen employee satisfaction, which will in turn create excellent customer care.
Deloitte’s travel report highlights how airports and hotels are doing this already: to address the labor gap, travel providers are leveraging new technology that’s both providing frontline workers with new skills and capabilities and improving the work experience.
In the same report, two-thirds of travel providers said they don’t anticipate tech innovations to cause staff reductions in the next five years, meaning a win-win for workers and customers.
3. Technology Happiness Continues to Fall from Record Highs
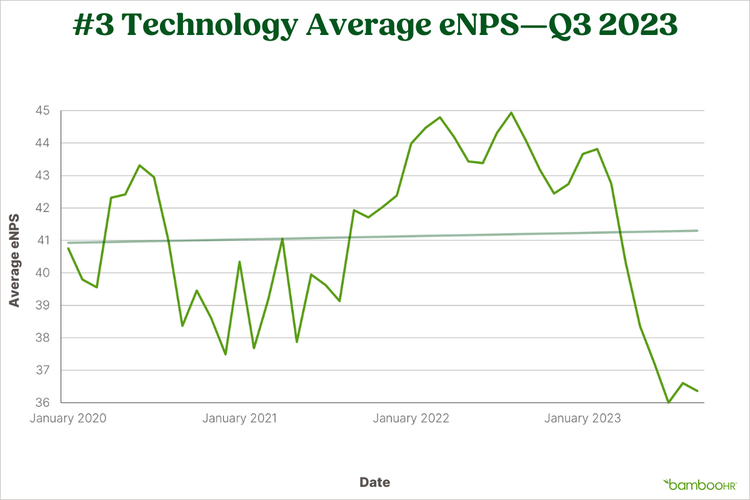
The tech industry has reached a worrisome record low in eNPS scores, consistent with the ongoing 2023 nose-dive. The short-term and YoY data both reflect continued decreases in employee satisfaction: Q3’s average dropped three points from Q2, with July hitting an all-time low eNPS of 36.
The reasons are dramatically clear: The all-but-dried-up venture capital funding has spelled a reckoning in the form of 240,000 lost tech jobs so far in 2023. Slowed sales and company spending have put increased pressure on remaining employees to grow profitability and do more with less, particularly headcount. And with the ever-present economic downturn, unhappy employees are hesitant to leave stable work.
How to Pierce the Gloom: Invest in Your Employees’ Future
The tech industry is undergoing seismic changes—financially with lost funding and decreased sales, and innovatively with the rise of AI. A recent Gallup poll found that 22% of workers are worried about being replaced by technology, in addition to being concerned about losing benefits (31%) and having their wages reduced (24%).
Be open with your employees about what the organization’s plans and strategies are for a successful future: for the business, for customers, and for employees. Presenting a strong vision of a shared successful future where employees will have expanded opportunities to improve their skills can help quell financial anxieties and layoff fears.
In addition to investing in new skills, don’t overlook the importance of investing in benefits and wages–it’s much cheaper than having to replace skilled talent.
4. Nonprofit’s Happiness Stable and Flat
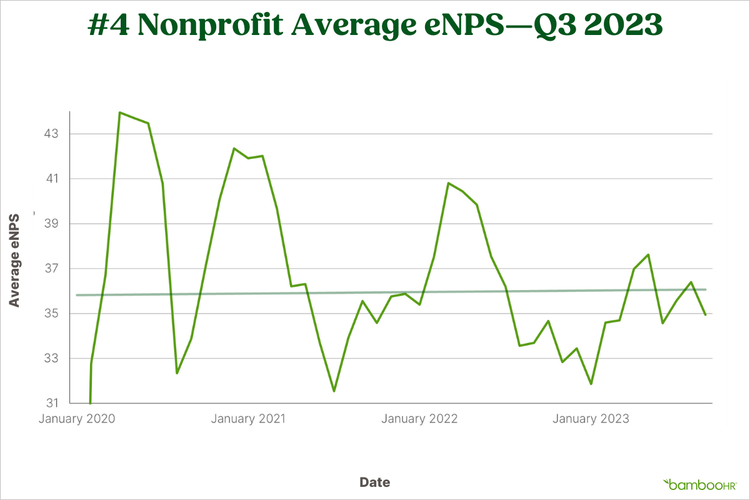
The data for the nonprofit industry shows a stable 36 eNPS score for both the 2023 Q2 and Q3 averages, remaining flat. However, when compared to the same period in 2022, there's a modest decline in employee happiness.
The National Council of Nonprofits 2023 survey reveals more than half of respondents report worker shortages, and 28% report longer waits for services, which is compounded by 70% anticipating flat or decreased charitable donations.
Similar to other industries, the primary reasons cited for job vacancies were salary competition (72%), budget constraints (66%), and stress or burnout (50%)
How to Pierce the Gloom: Focus on Unique Benefits and Purpose
With salary competition looming large for most industries, nonprofits will have to get creative. Create a recruiting and retention edge by offering what employees want most: expanded benefits, flexible scheduling, hybrid work, PTO, skills and manager training, and mental health support. Use a Total Compensation Calculator to show employees the full value of what you offer.
Also, make sure employees feel connected to your mission and see the important impact they’re making. Research from McKinsey finds there’s often a “purpose hierarchy gap” between leadership and employees, with execs being five times more likely to feel purpose at work than frontline managers and employees.
5. Finance Happiness Down 17%, Drops from #3 to #5
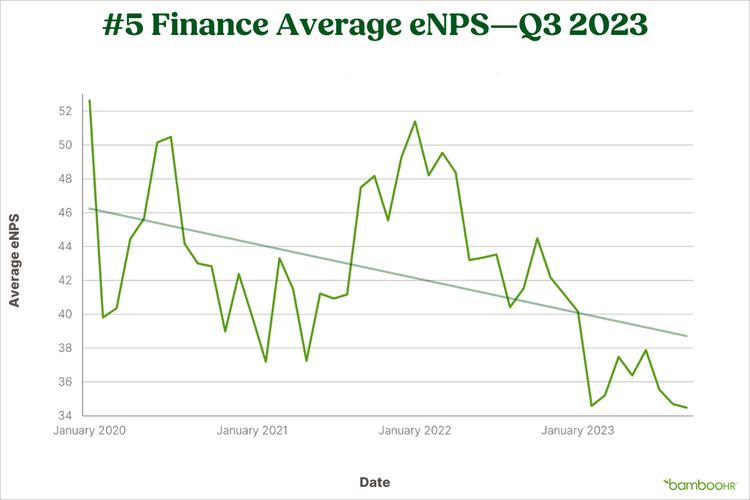
Tech and finance continue to mirror each other, with a new three-year low in finance employees’ eNPS.
While finance saw a reversal of early 2023’s upward trend, September 2023 marks a new three-year low in eNPS at 34. The short-term and YoY data both reveal substantial decreases in employee satisfaction.
Compared to the eNPS for the same period in 2022, the finance industry has experienced an eight-point decrease (or a 17% decline) in employee happiness.
Deloitte’s 2024 banking and capital markets outlook reports complicated and multi-faceted challenges will continue to slow financial sector growth, including rising interest rates, assertive regulations, geopolitical tensions, and new technologies. The front-line employees acting as financial advisors and intermediaries are certainly feeling the strain.
How to Pierce the Gloom: Less Time in the Office
Finance is known for its competitive nature, high bar of entry, demanding hours, and pressure to deliver. Those who make it are high-achievers, making them susceptible to burnout. As “the war for talent in technology remains a pressure point...banks may have to pay dearly to hire specialized tech talent from outside businesses or train their own employees to become more tech-savvy, especially as innovations from and within AI expand,” according to Deloitte.
With recruitment and retention challenges looming large, it'll be critical to identify current employee needs, like more PTO and opportunities for skills and management training, while catering to new hires with flexible and remote roles. Another Deloitte survey on employee engagement in financial services reported that 66% of remote workers would leave if mandated to return to the office.
6. Healthcare Happiness Up 17%, Jumps from #8 to #6
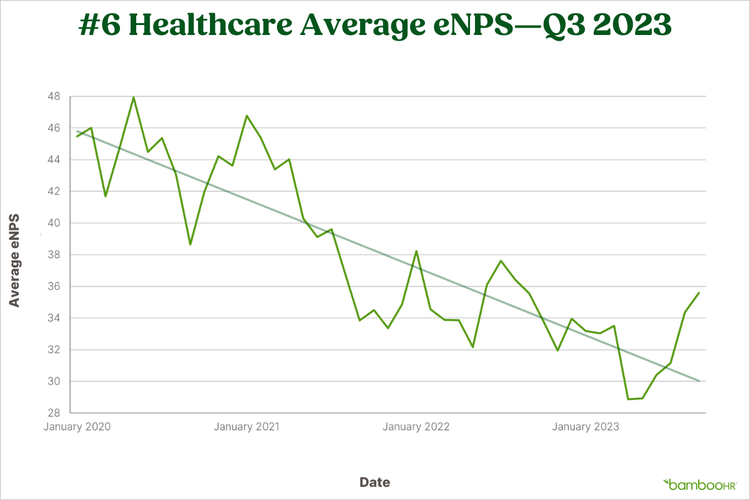
The healthcare industry in Q3 2023 shows a remarkably positive rebound in employee happiness.
After a concerning dip in the previous quarter, the industry has experienced a significant improvement, with a five-point increase in eNPS from Q2’s average to Q3 2023 (15% increase). The short-term and YoY data both demonstrate stability and even an increase in employee satisfaction—the notable 17% increase in eNPS since June 2023 indicates a rapid upturn in employee satisfaction.
While this upward trend is encouraging, healthcare heroes aren't out of the woods. They continue to face considerable challenges and stress from continued staff shortages, depression and anxiety, burnout, increased workloads, increasing harassment from patients, and challenging work conditions.
Milder COVID-19 strains and vaccine accessibility could spell some stabilization for the industry overall, but there's still work to be done to improve working conditions in healthcare.
How to Pierce the Gloom: Heal the Healers
According to the 2022 National Nursing Workforce Survey, "more than one-quarter of all nurses report that they plan to leave nursing or retire over the next five years," including an estimated 1 million highly experienced Baby Boomers, who as they age will put stress on the industry they left.
The critical non-negotiable for attracting nurses to the field and stemming the flow of nurses leaving is to create a positive environment for both the patient and the provider. Like flight attendants say, “Put your own oxygen mask on first before helping others.” Similarly, in order to provide irreplaceable specialized care to the most vulnerable, healthcare professionals need to be well themselves.
The American Nurses Foundation 2022 Assessment said only 35% of nurses viewed their emotional health as healthy or better. Safe patient-to-healthcare worker ratios, enough time off, access to mental health benefits, and protective measures against violence will be the minimum to keep workers in the field.
7. Education Sees Happiness Uptick, Still Down 5% YoY
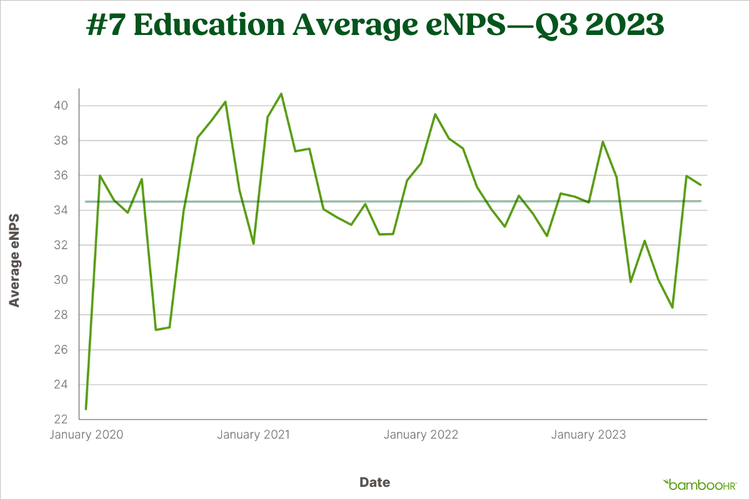
The data for the education industry in Q3 2023 suggests a positive uptick in employee happiness, particularly as the school year begins.
The Q3 eNPS score was 33, two points higher than Q2. The 18% increase in eNPS since June 2023 indicates a notable improvement in employee satisfaction.
Although there is a slight 5% YoY decrease in eNPS, it's relatively modest compared to the recent improvements. This indicates that the education industry may be successfully addressing challenges and enhancing employee happiness during this period.
The start of a new school year consistently signals an increase in eNPS because educators are deeply committed to the higher purpose of helping their students.
How to Pierce the Gloom: Share the Burden
Teachers endure high stress and low pay because of the stewardship they feel for the next generation: a 2023 Survey of America’s Educators showed 80% of all teachers plan to spend their entire career as a classroom teacher, but 64% wouldn’t recommend it to someone they know.
The lingering effects of the pandemic on student achievement are likewise sobering. The average student will need around four months of schooling to catch up in reading and math, according to NWEA pandemic recovery research. With testing scores measuring teachers' success, this paints a particularly discouraging picture for educators.
Hiring more teachers to reduce classroom size would address the added needs of today’s students, in addition to more resource specialists and teacher aides. A third of teachers say they have insufficient access to basic necessities, so administrators should ensure teachers have curricular materials and curriculum and assessment training.
8. Restaurant, Food, and Beverage Happiness Drops to Last
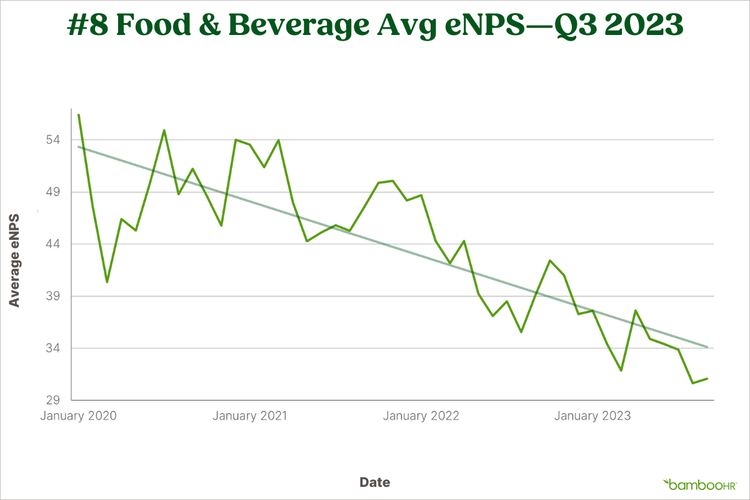
The restaurant, food, and beverage industry in Q3 2023 reached a new three-year low in eNPS, with a substantial drop from the previous quarter, and a notable decrease since June 2023, a concerning and sustained decline in employee happiness.
The average eNPS for Q3 is down by four points from Q2, marking a 10% drop since June 2023, surpassing the previous low from March 2023, and a substantial 21% or eight-point drop in September YoY scores.
The National Restaurant Association reports the restaurant industry is the second-largest private sector employer, currently employing almost 10% of the total US workforce. Yet tanking scores point to further fallout of food service businesses still being short-staffed, putting added responsibility on employees who are spread thin and wage-dependent on tips to make ends meet.
Inflation and contested wage legislation, combined with slowing consumer spending, means paychecks that aren’t covering what they used to.
How to Pierce the Gloom: Foster Inclusion, Stability, and Security
Almost one in five (17%) US employees work an unpredictable or unstable schedule, with short notice of changes and inconsistent hours being a barrier or burden for many, particularly for caregiver employees. Brookings research shows that asking employees to stay longer than originally scheduled has a negative effect on sales.
To create more stability and inclusion, employers in the food industry can lean on technology, like making use of scheduling systems that only schedule employees during their availability. There are also shift marketplace apps that make it easy for employees to trade or pick up shifts that keep employers in the loop.
But while picking up extra shifts and having control over available hours greatly supports food workers, too many still struggle to make ends meet and are also food insecure at home. Those making the minimum wage are the most financially vulnerable. A little compassion, accommodation, and support can go a long way.
About BambooHR
BambooHR® is the leading provider of cloud-based HR software solutions that empower HR professionals to manage, support, and grow what matters most—their people. As a company, BambooHR's mission is to set people free to do great work, by automating, centralizing, and connecting employee data all in one place to support better decisions.
The platform’s intuitive and intentionally designed payroll, time tracking, benefits, performance, and reporting solutions support the full repertoire of HR responsibilities—all backed by award-winning customer service. Over the past 15 years, BambooHR has been the trusted partner of HR professionals at 32 thousand companies in over 150 countries and 50 industries, for supporting millions of users throughout their employee experience.
Methodology
All source data is from the BambooHR eNPS platform gathered between January 2020 and September 2023 and includes more than 1,600 companies, tracking anonymous responses from over 57,000 unique employees since January 2020. The data analyzed includes more than 1.6 billion self-reported eNPS scores that have been analyzed in an aggregated, anonymized way to protect the privacy of employees and the integrity of the metric.
Industries highlighted include healthcare, finance, construction, travel and hospitality, nonprofit, restaurant/food and beverage, education, and technology. Further demographics included are company region, company headcount, and average employee tenure at a company. Volatility is calculated monthly using the difference between that month and the previous month’s average eNPS.
31% of HR Managers Say They Need Better Employee Data Protection
Discover insights into employee perception and experience with data security—and how to better protect your workforce data.
First Impressions Are Everything: 44 Days to Make or Break a New Hire
70% of new hires decide whether a job is the right fit within the first month—including 29% who know within the first week. Onboarding makes all the difference.
The Great Gloom: In 2023, Employees Are Unhappier Than Ever. Why?
Read the Employee Happiness Index report for Q2 2023 to learn which industries are most affected—and what business leaders can do to remedy the situation.